25S_IT00EB97-3004 / Modules 11 - 12: Intrusion Prevention / Lab 9. Snort with Linux
Installing Snort using apt package manager: sudo apt install snort
(During the installation you have to tell the Snort, which interface/network to use. Open another terminal and use the ifconfig command to figure this out, if needed…)
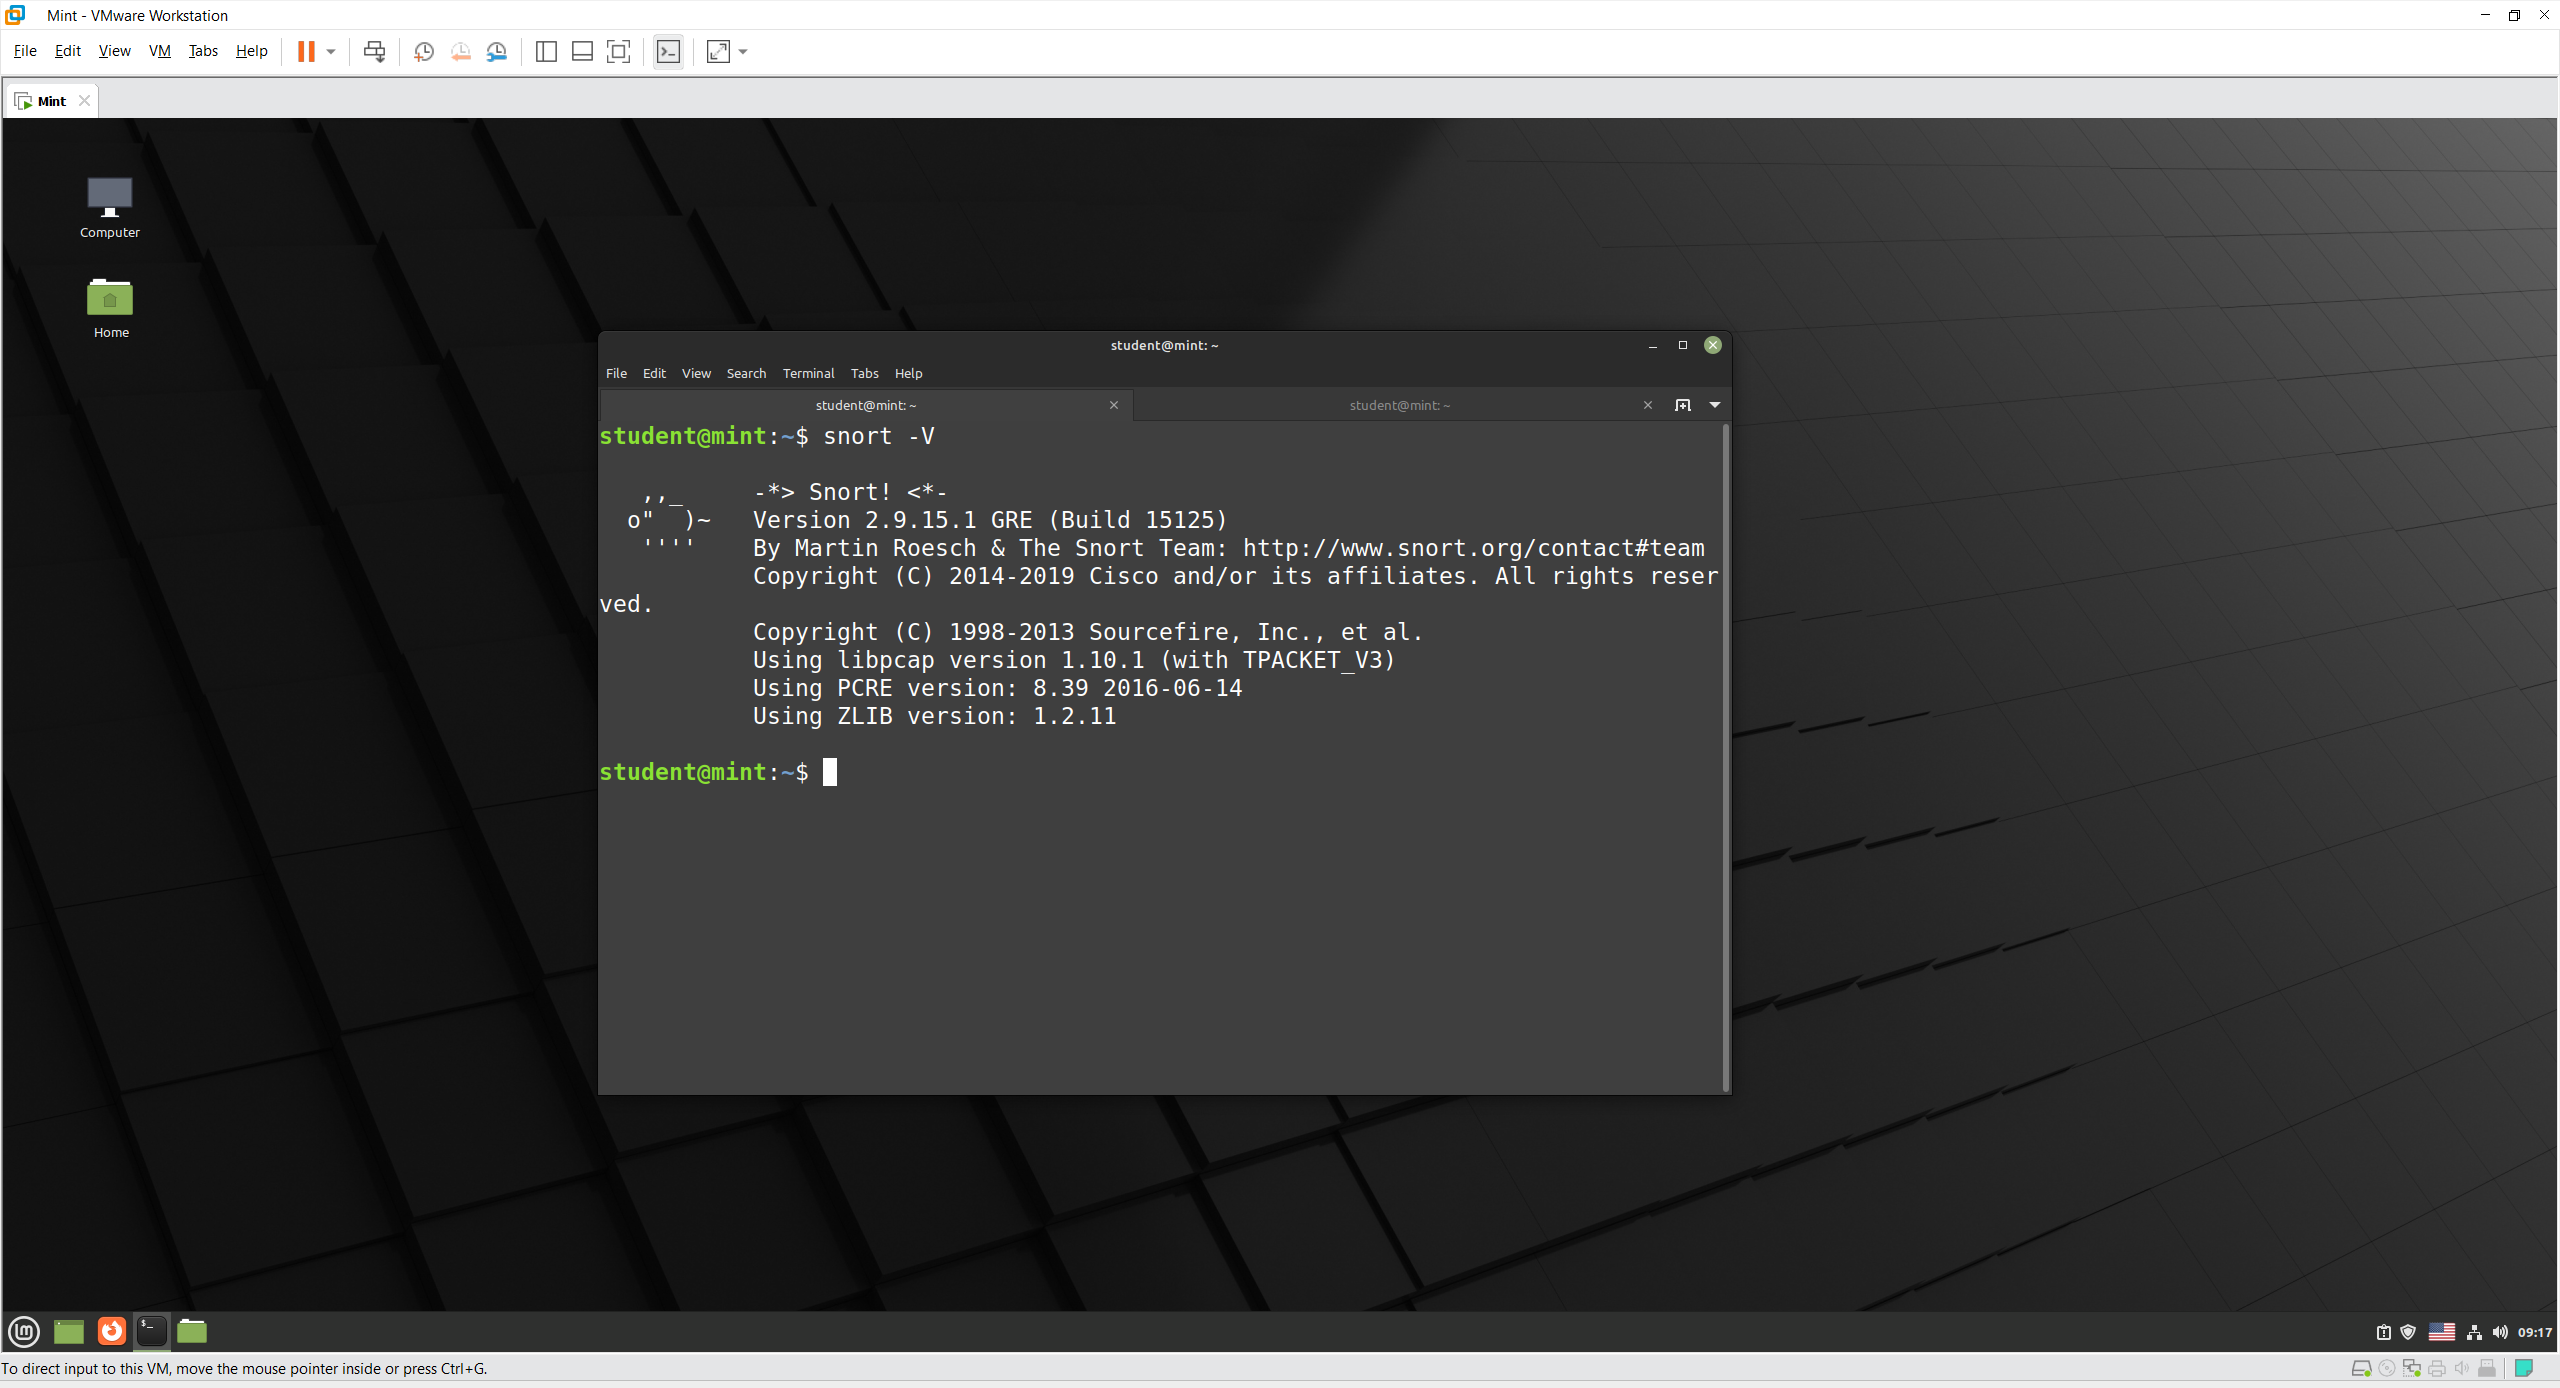
To verify that we have installed Snort correctly: snort -V
Check the Snort options from the terminal using: snort -?
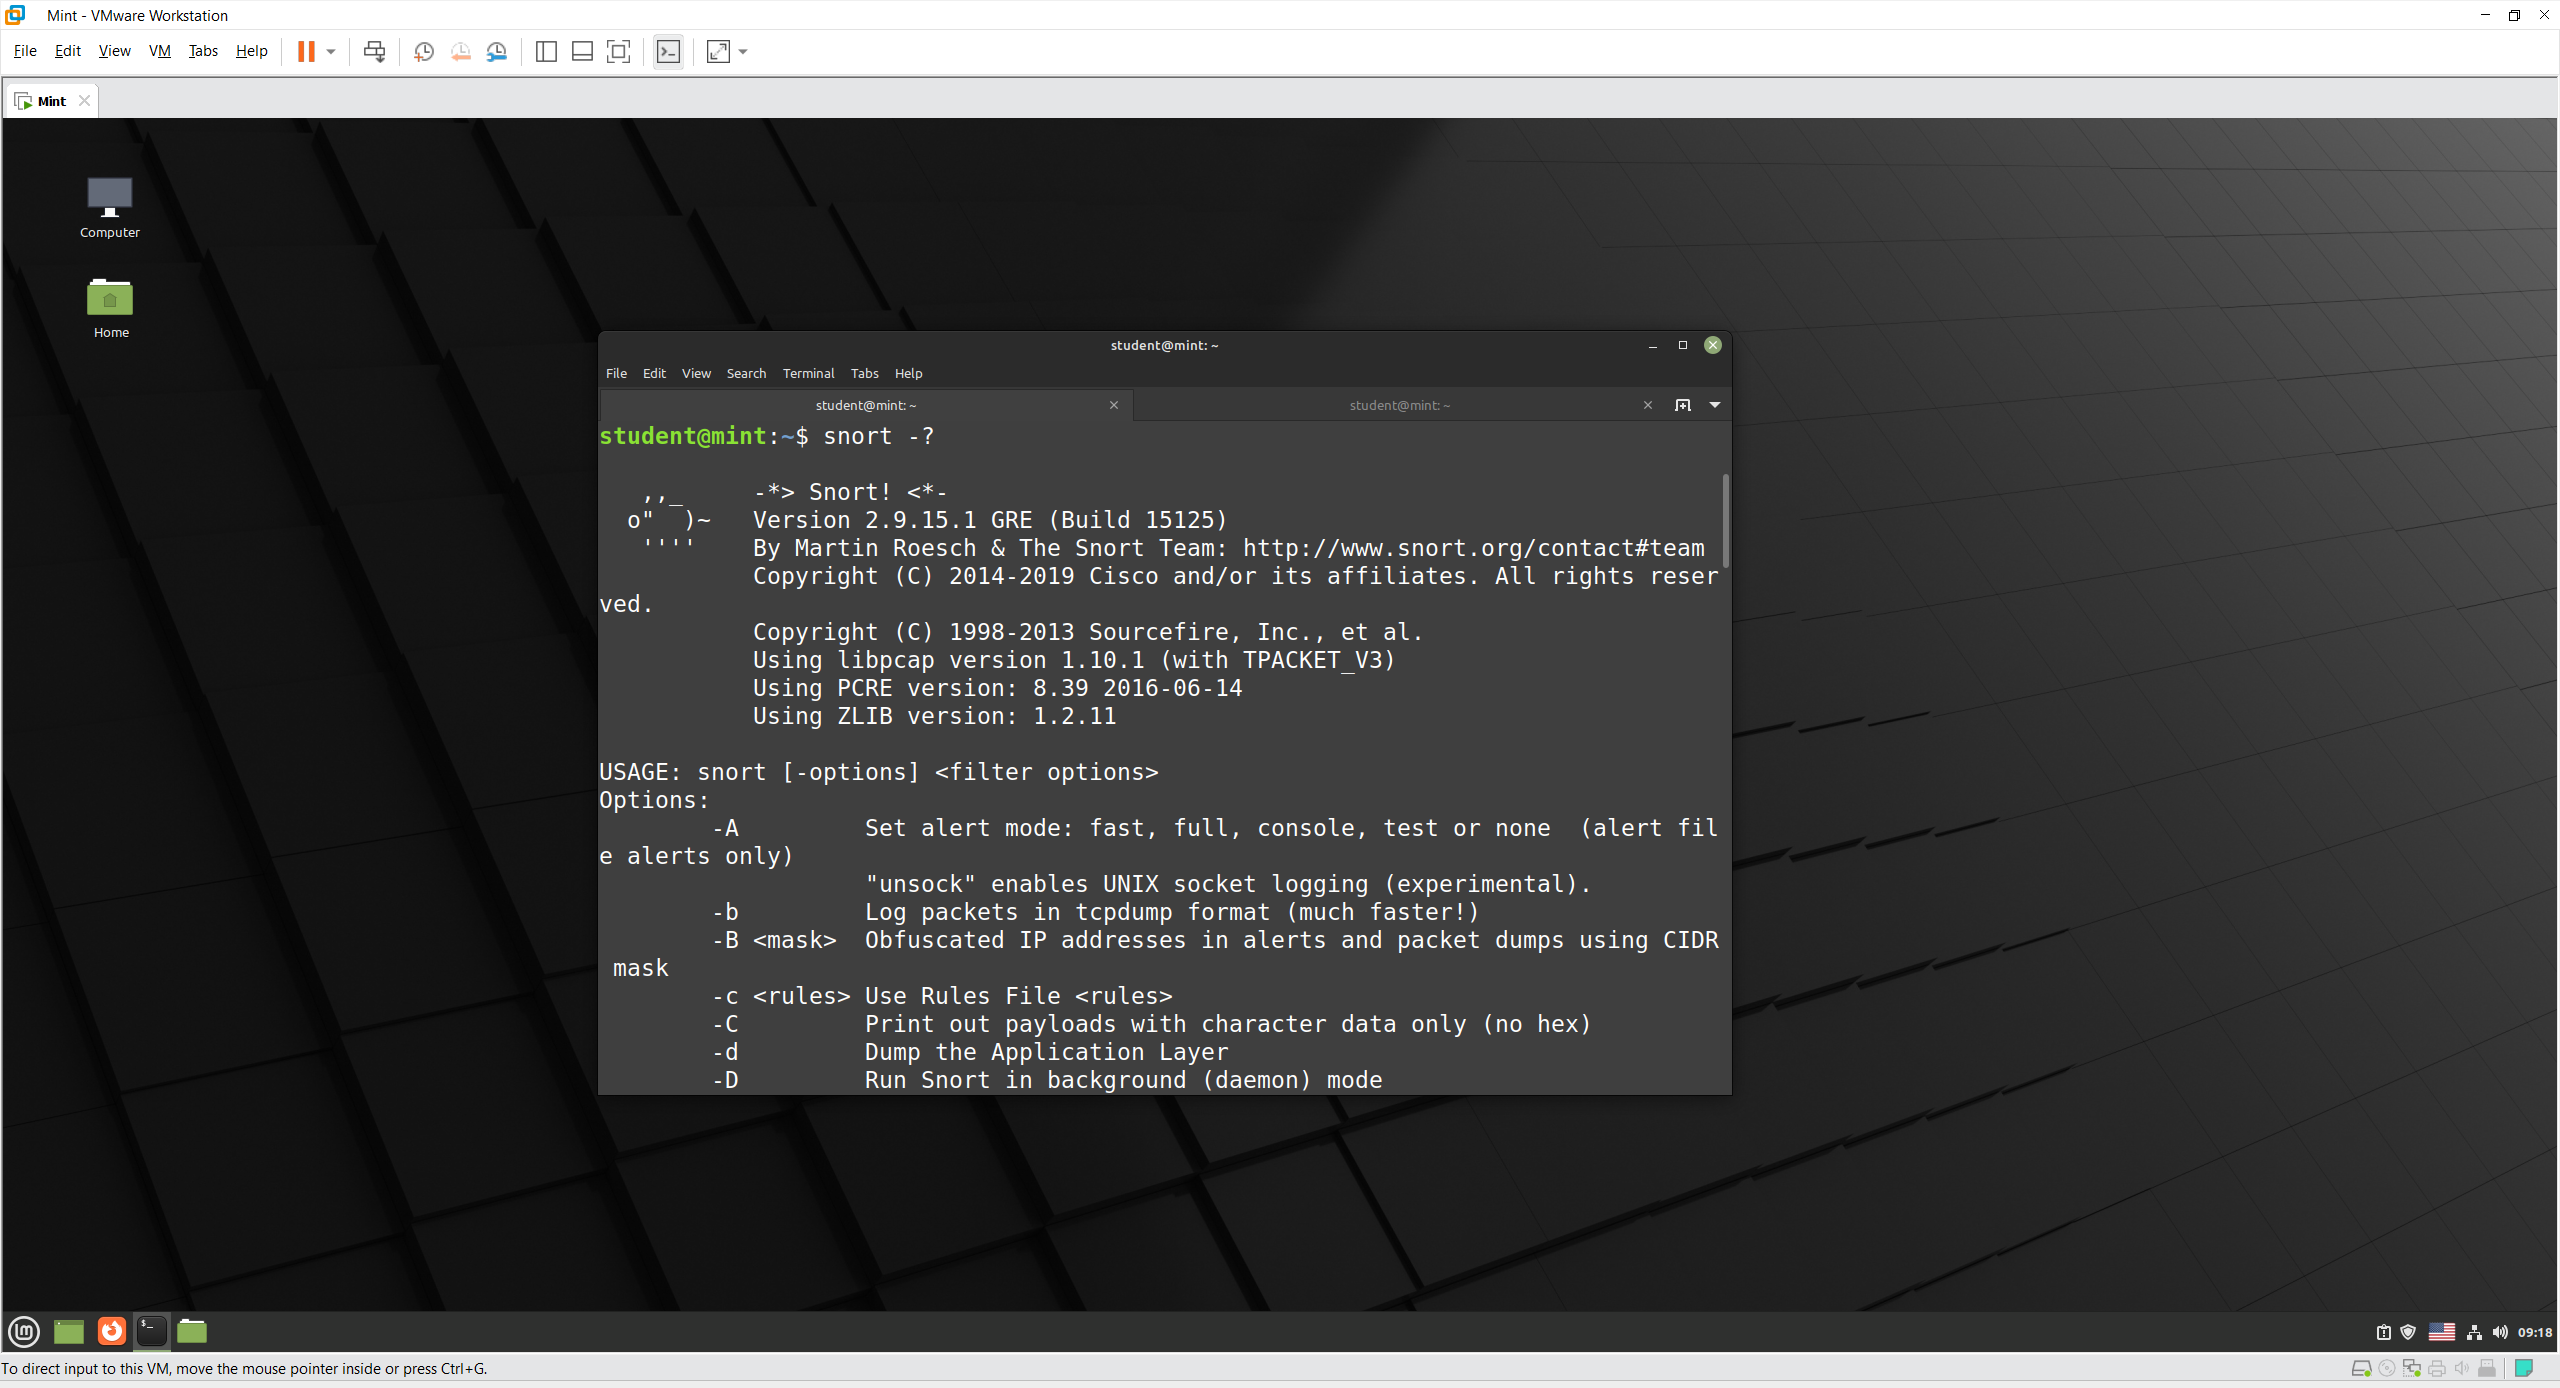
Some of the first flags are -A, -b, and -c with different use case:
-A: This option configure the alert mode, which is the print output of the captured traffic, set to fast for one line. While full will print Snort alert messages with full packet headers.-b: This module logs packets to a tcpdump-formatted file. This is useful for performing post-process analysis on collected traffic with the vast number of tools that are available for examining tcpdump-formatted files.-c: Specify the Rules File for Snort to use, which I will try below.
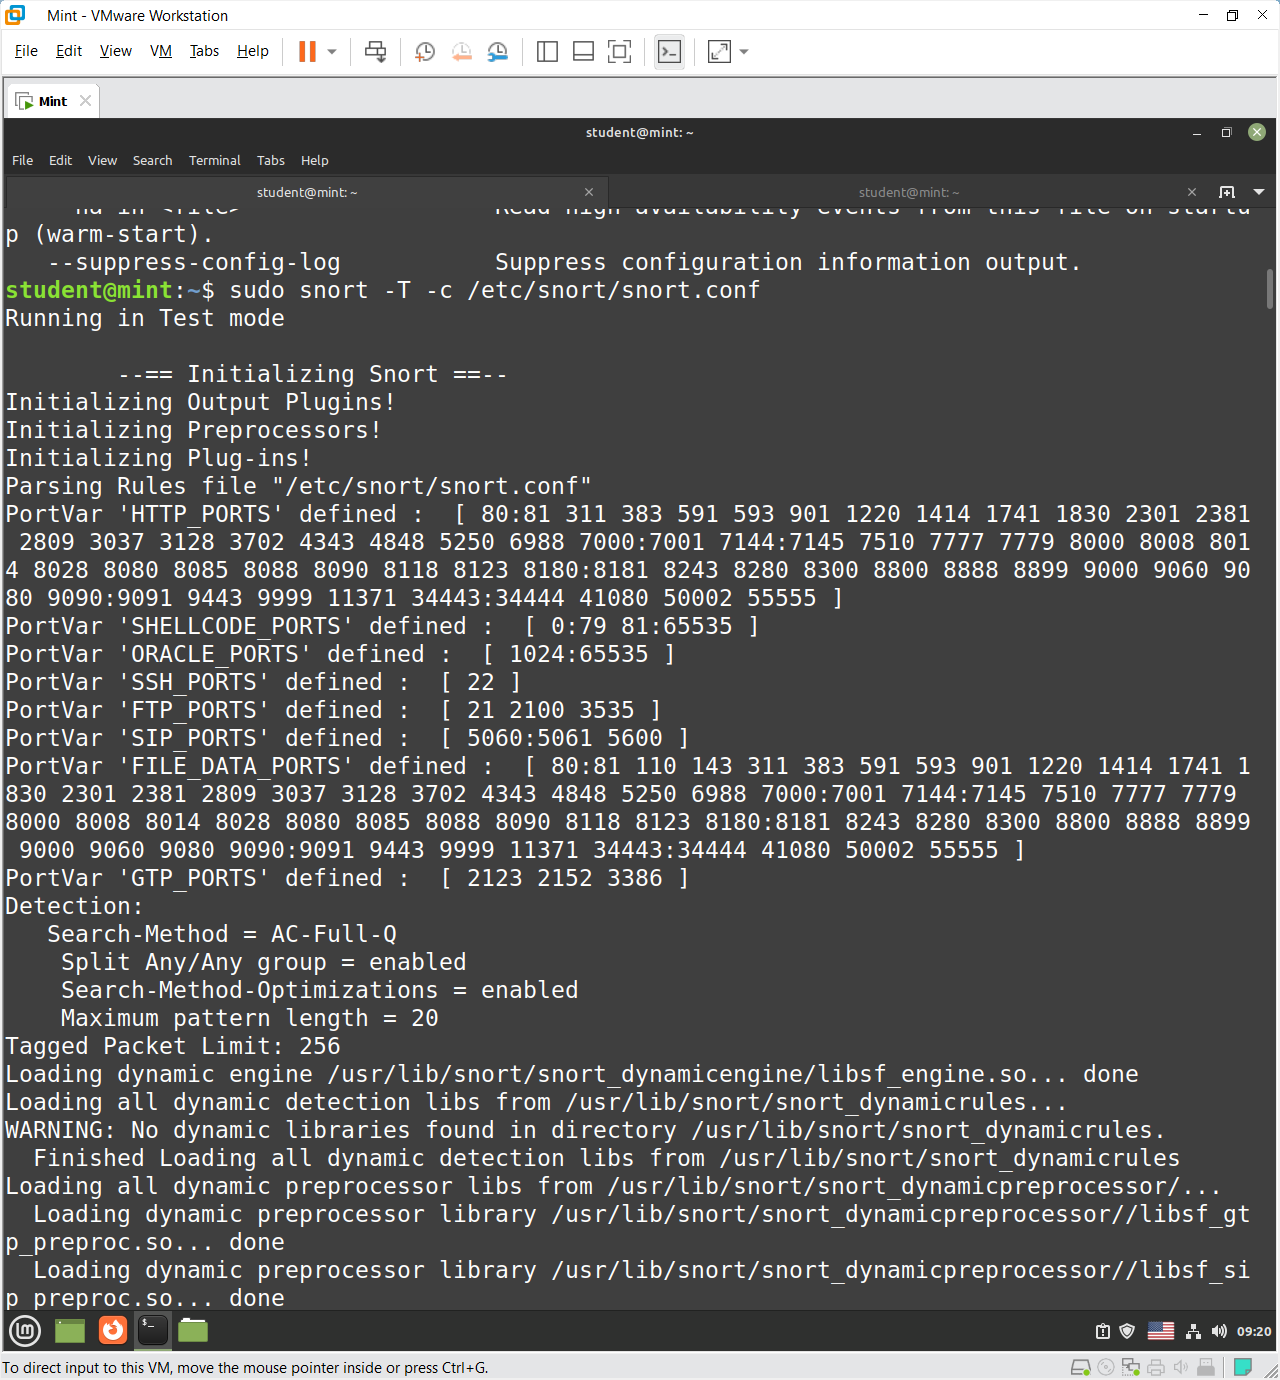
Test running with configuration file: sudo snort -T -c /etc/snort/snort.conf
snort [-options] -c conf [-T]: validate conf
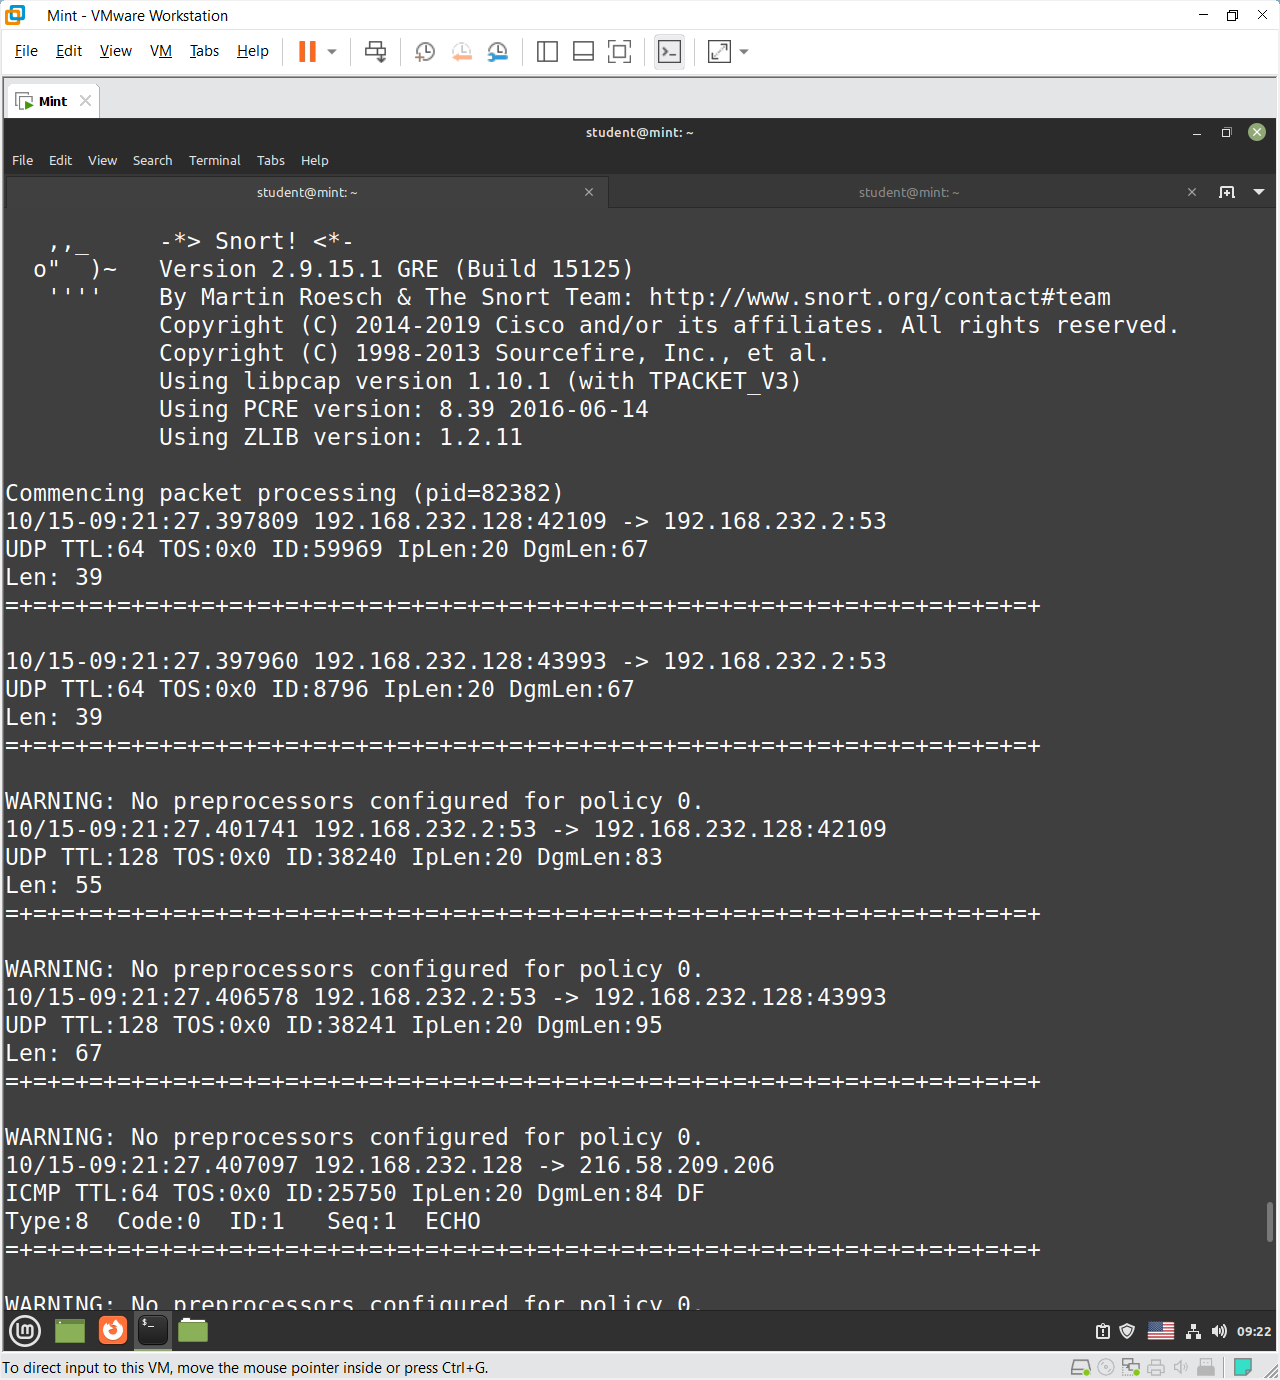
ping command
From the command outputs, there are information about:
- Timestamp
- Source and Destination IP + Port
- Protocol
- Time To Live
- Type of Service
- ID
dgmlen- total packet length as seen by the IP layer, inclusive of IP header, any higher layer headers, and the payload.iplen- the IP header length.
Now testing with different type of traffic:
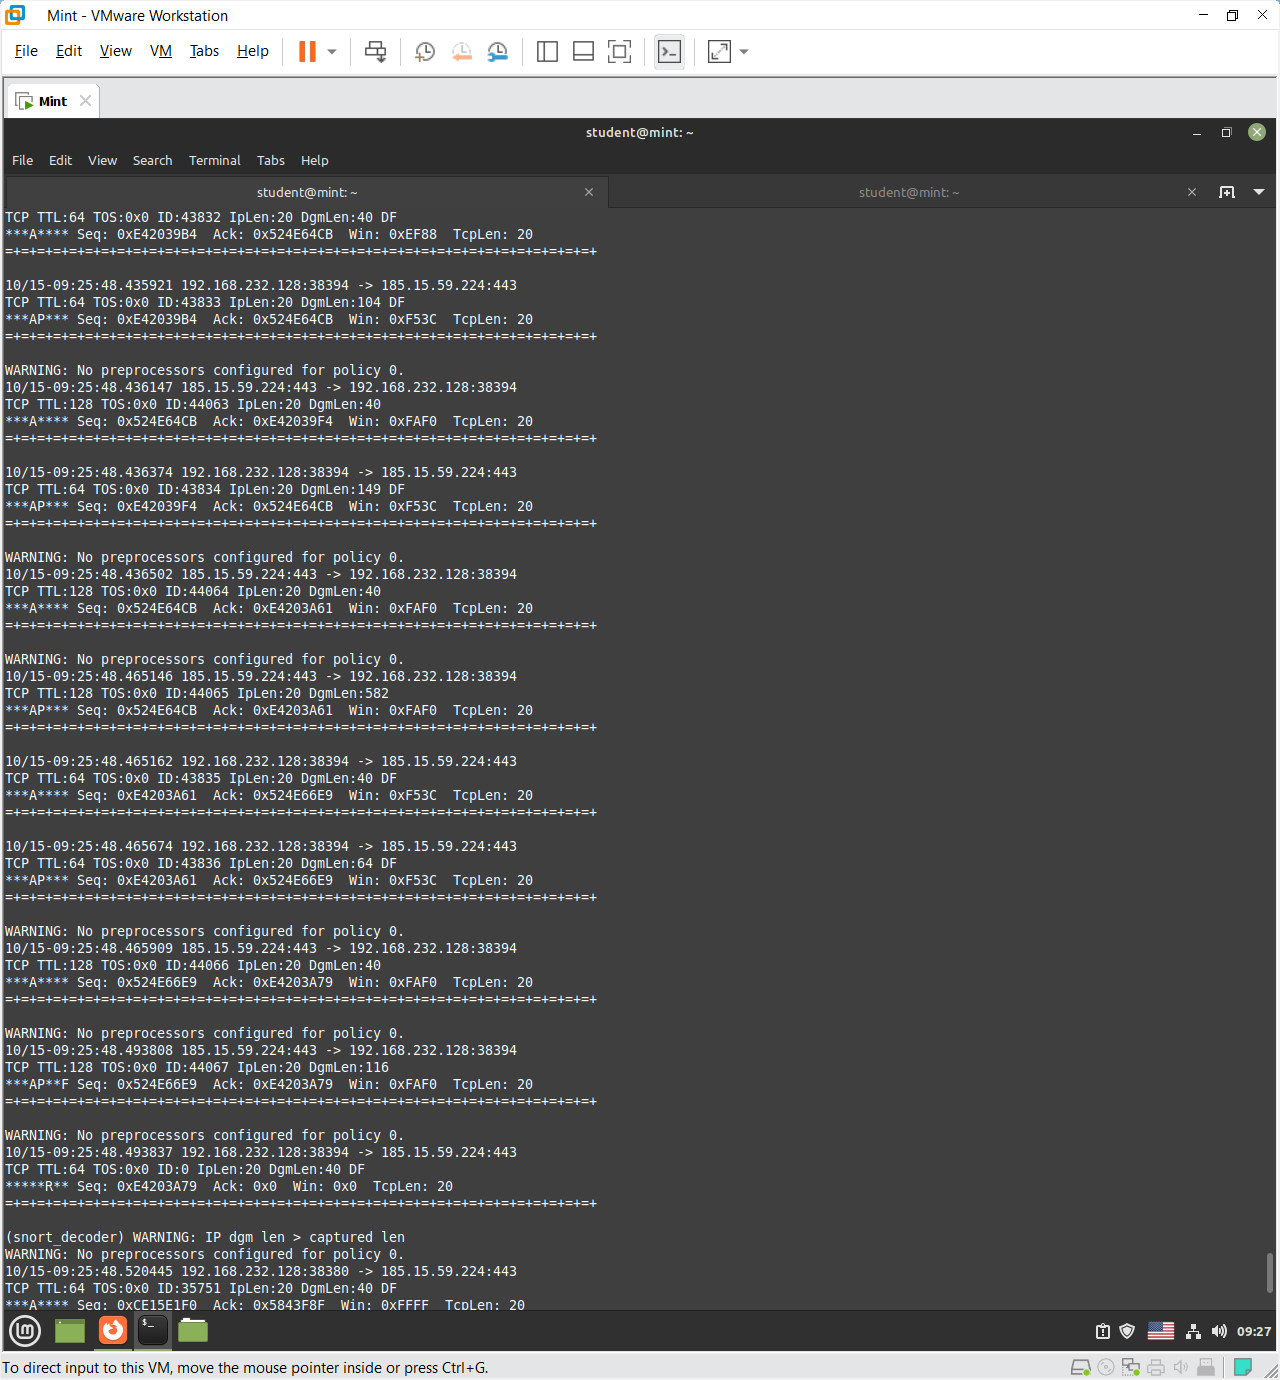
The Snort capture displays detailed metadata about network packets, including timestamps, source, and destination IP addresses, ports, and TCP/IP header fields such as TTL, sequence, and acknowledgment numbers. It shows the direction and timing of communication, protocol information, and session flow between hosts. While the actual payload (e.g., HTTPS data) is encrypted and unreadable, the capture still reveals how devices communicate and exchange packets across the network.
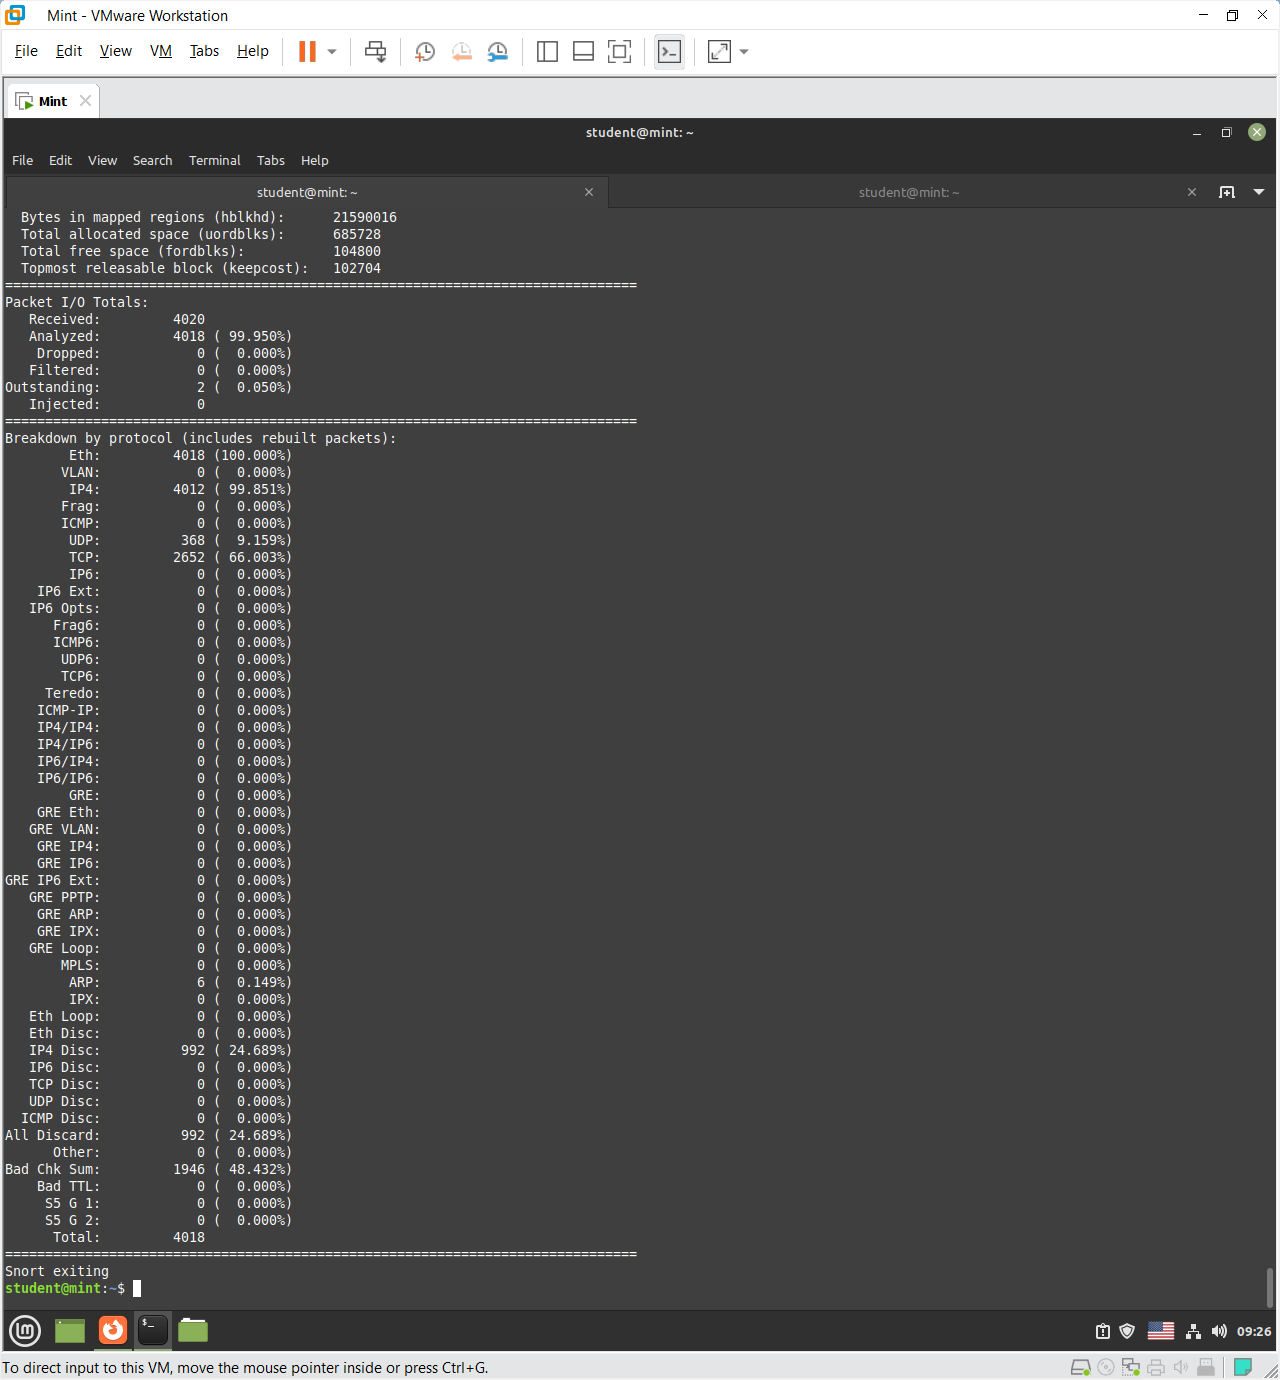
This Snort summary shows packet and memory usage statistics during capture. It indicates 4020 packets received, with 4018 analyzed (99.95% success rate) and no dropped or filtered packets. The protocol breakdown reveals that nearly all traffic was Ethernet (100%) and IPv4 (99.85%), primarily TCP (66%) with some UDP (9%) and a small number of ARP packets (0.15%). About 24.7% of packets were discarded, and nearly 48% had bad checksums—likely due to checksum offloading by the network interface card, not actual errors. No IPv6 or tunneling protocols were observed, indicating normal IPv4-based traffic during the analysis.
-dv flag and capturing web traffic
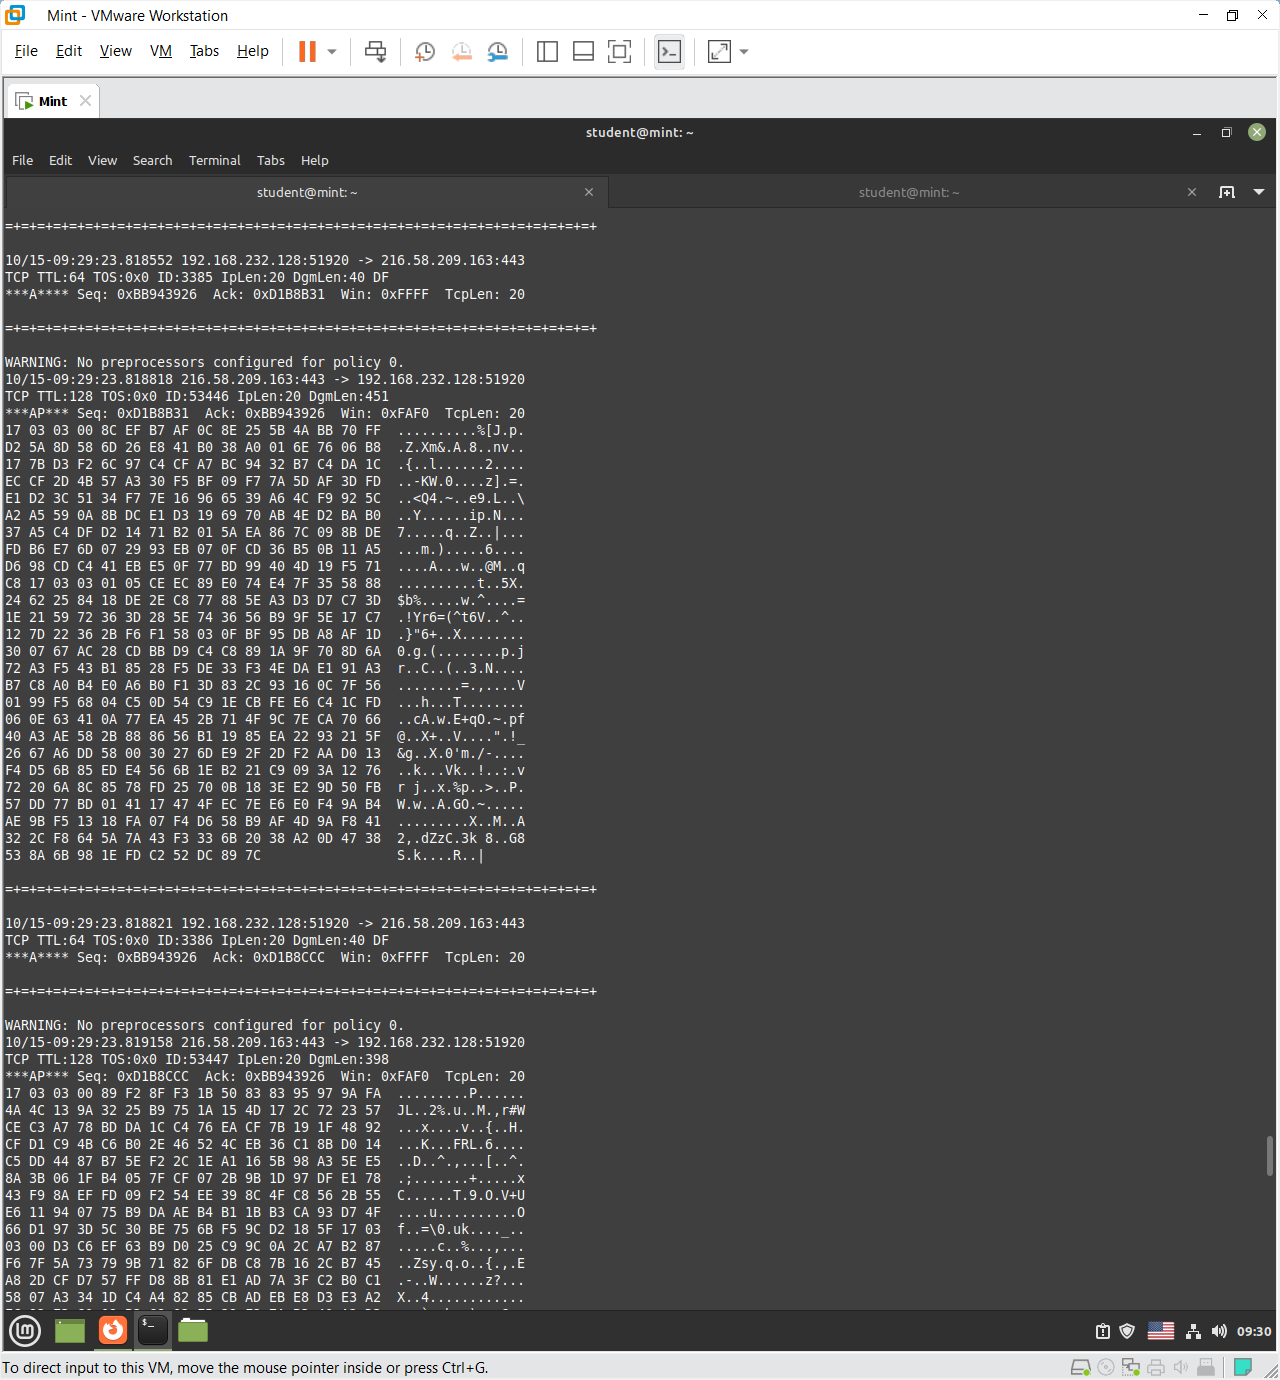
The -d option in Snort tells the program to display the full packet data payload in both hexadecimal and ASCII format for every captured packet.
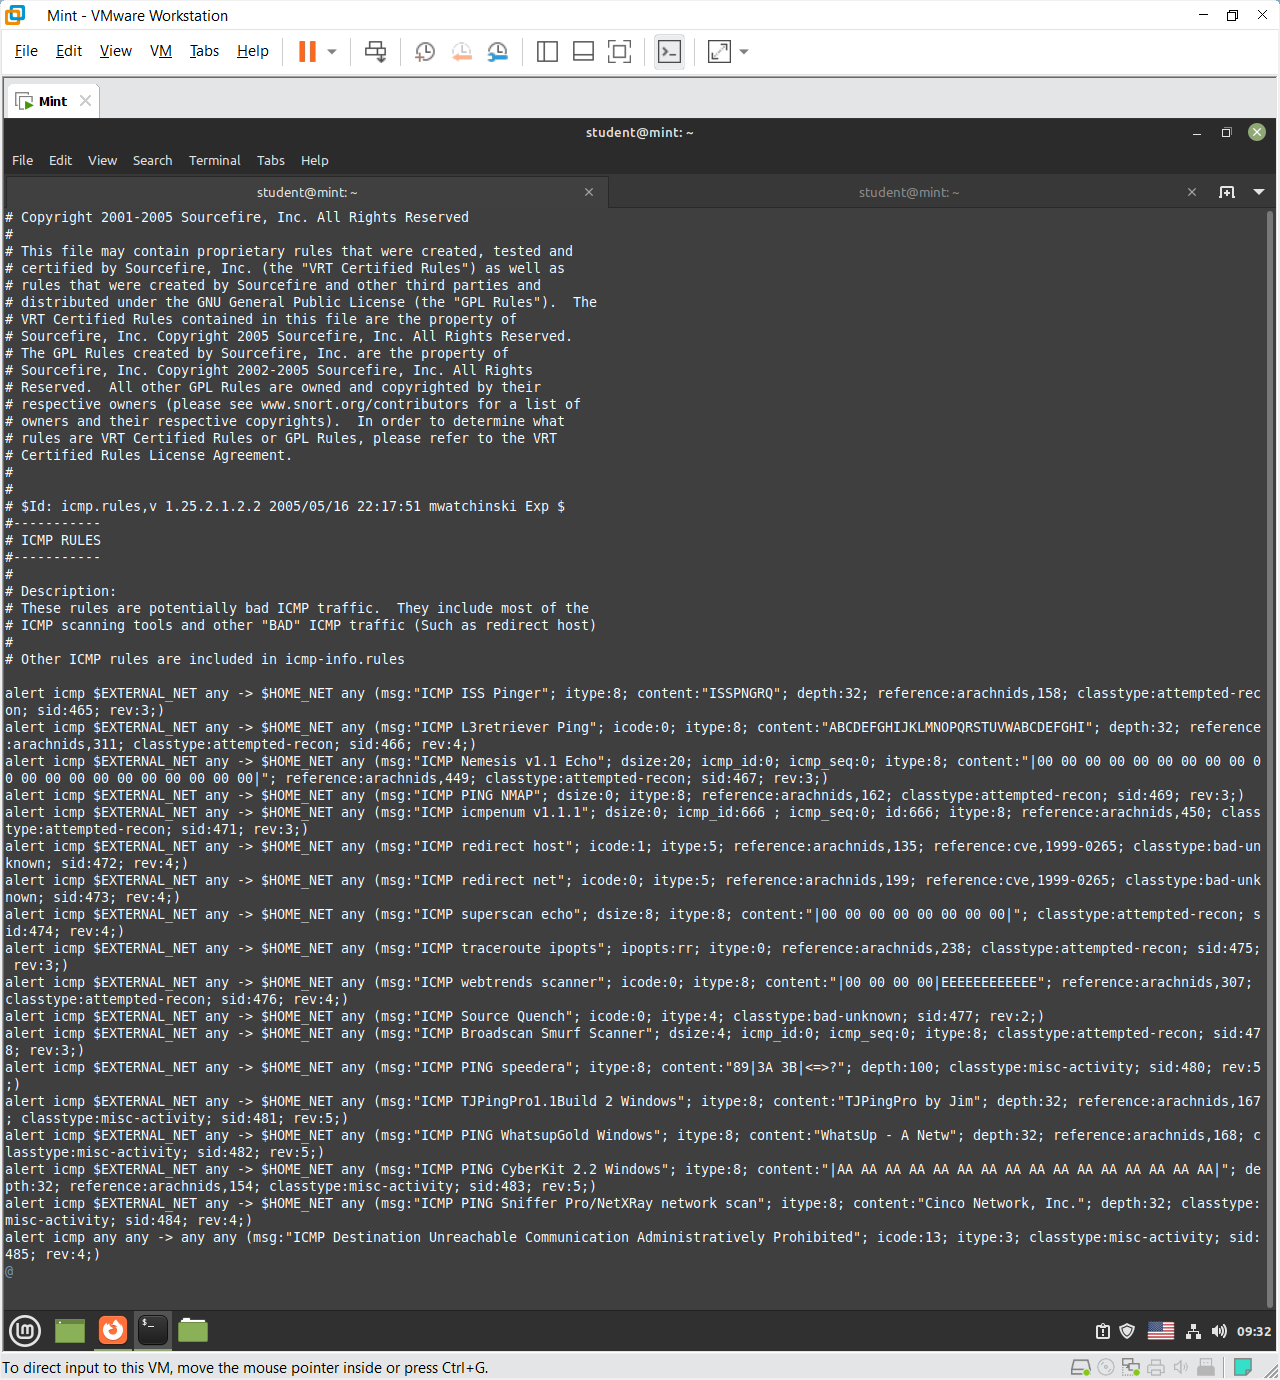
/etc/snort/rules/icmp.rules rule file
The icmp.rules file contains Snort signatures that detect suspicious ICMP traffic, such as ping sweeps, host discovery, and redirect attacks. Each rule specifies conditions like ICMP type, payload content, and direction to trigger alerts. Examples include detecting tools like Nmap, CyberKit, and WhatsUpGold, as well as ICMP redirects linked to known vulnerabilities (e.g., CVE-1999-0265). In short, these rules help identify potential reconnaissance or misuse of ICMP on the network.
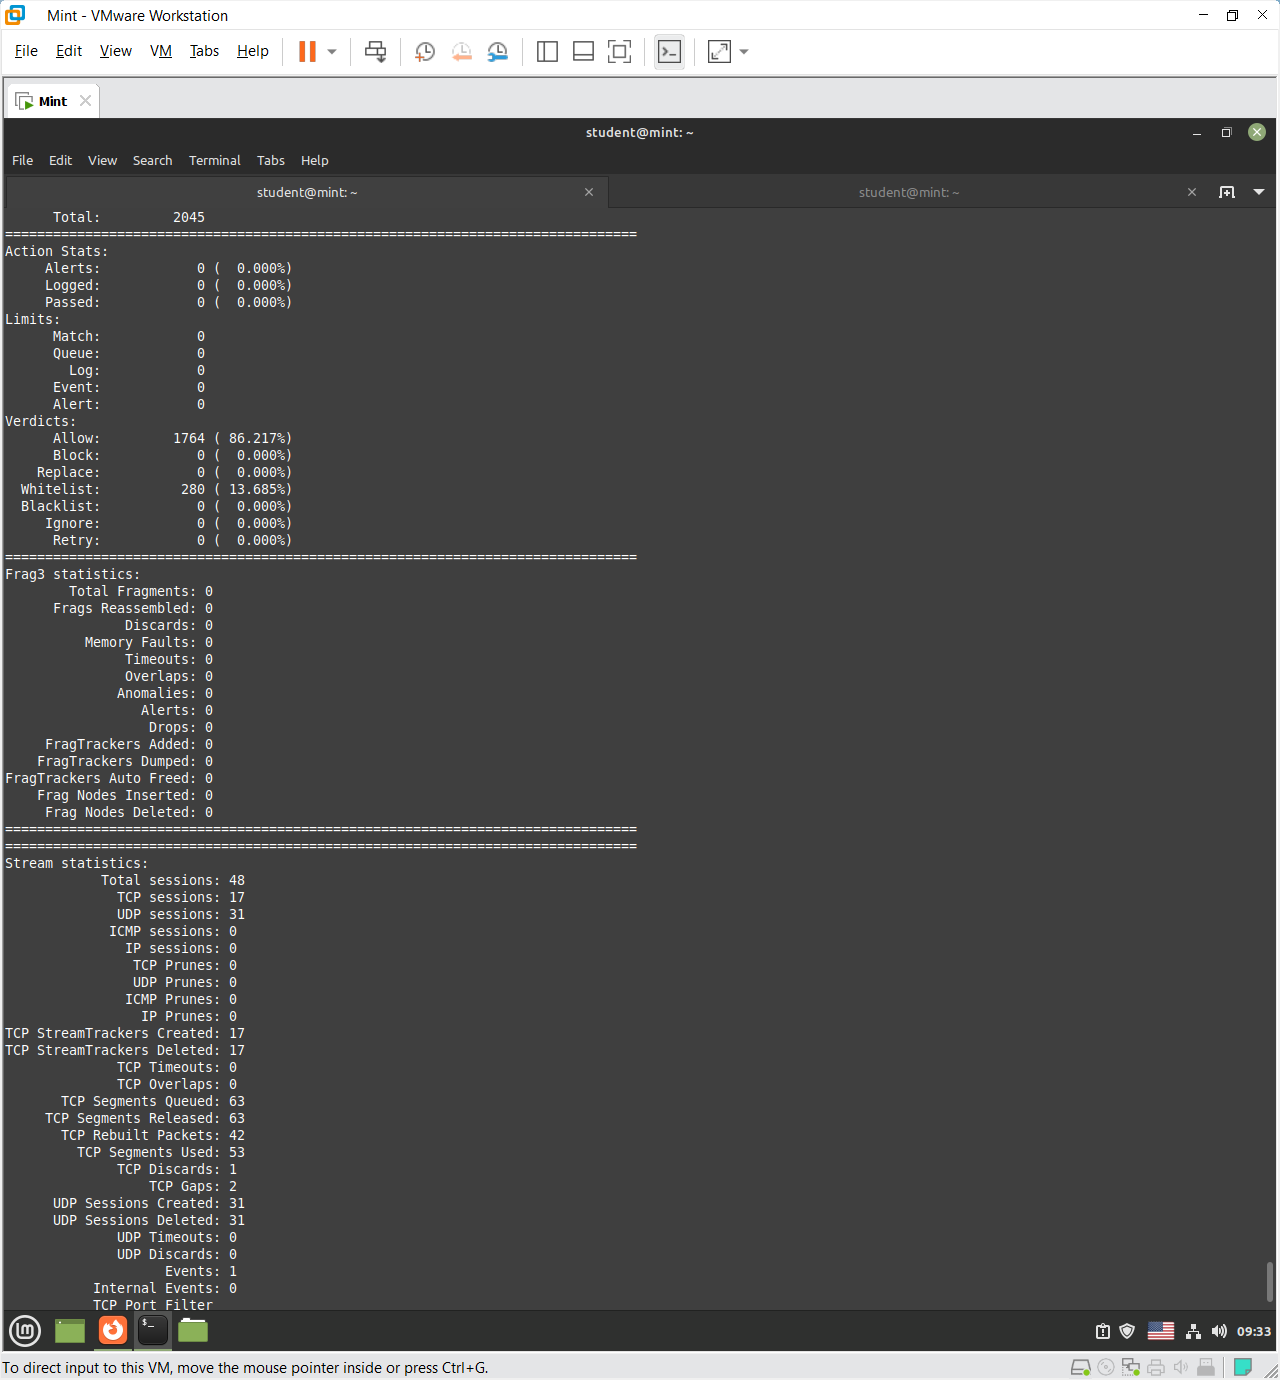
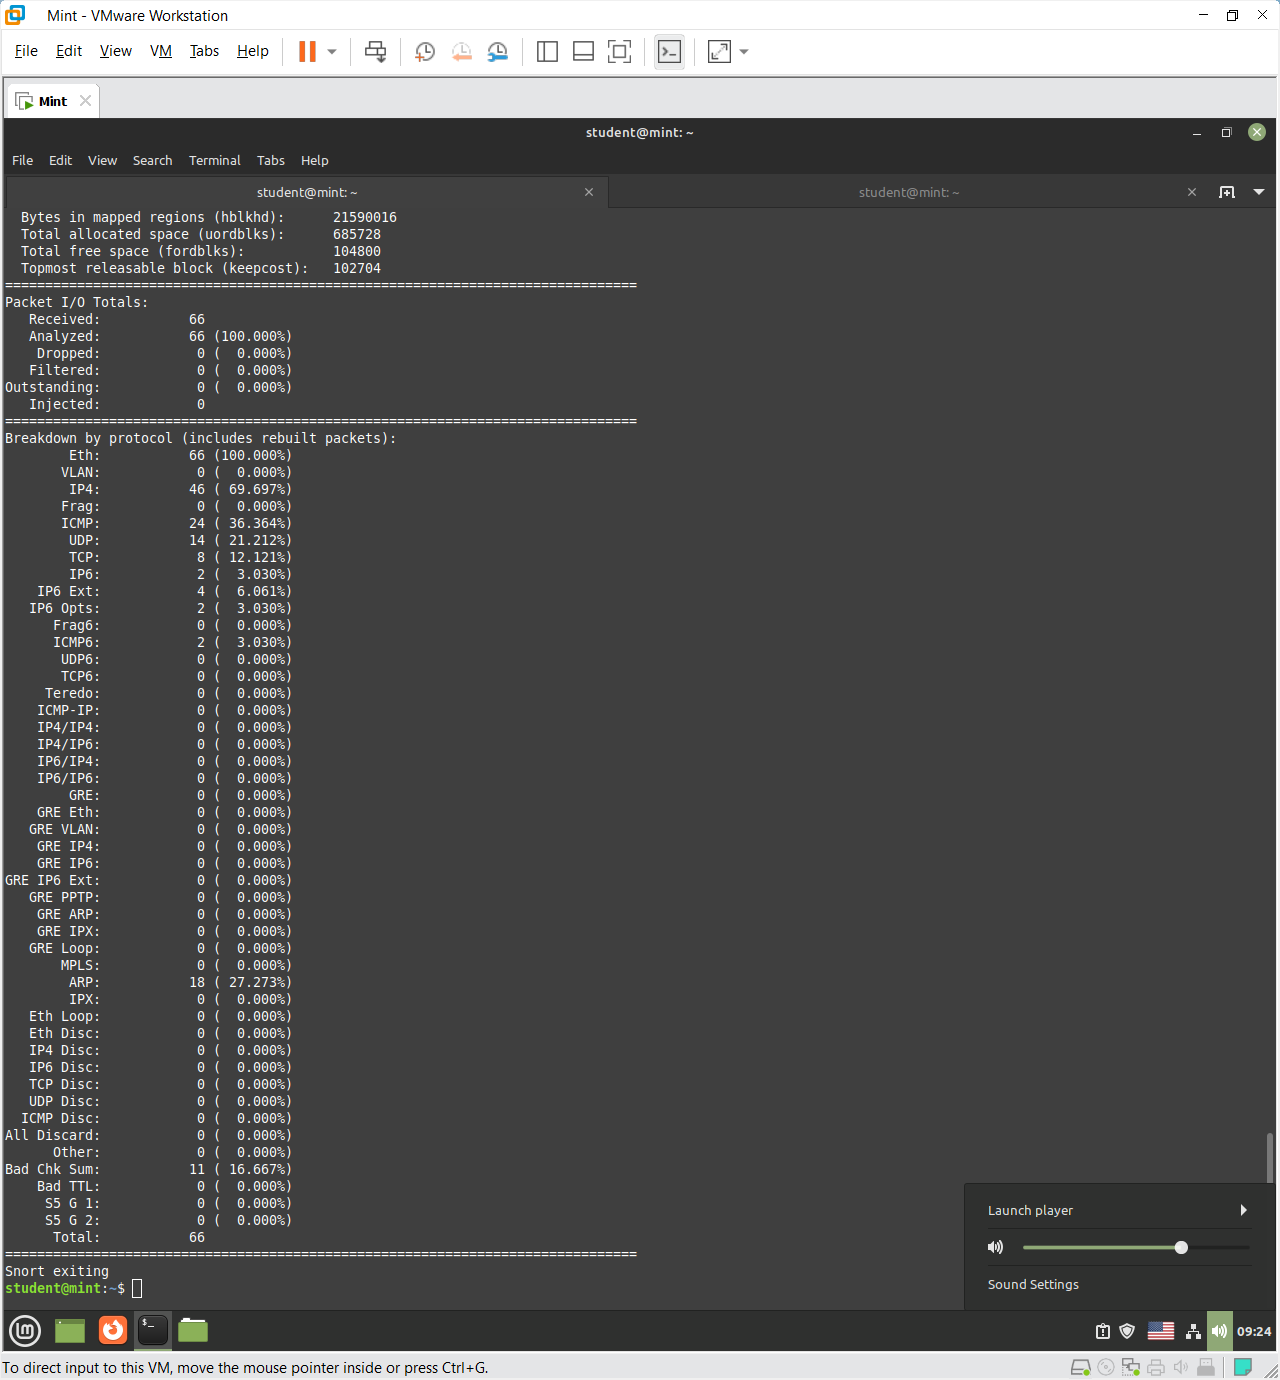
Overall, the additional information reveals that Snort acted as a passive network monitor, inspecting, and reconstructing TCP sessions without dropping or blocking traffic, and collecting detailed session-level and packet-level TCP metrics.
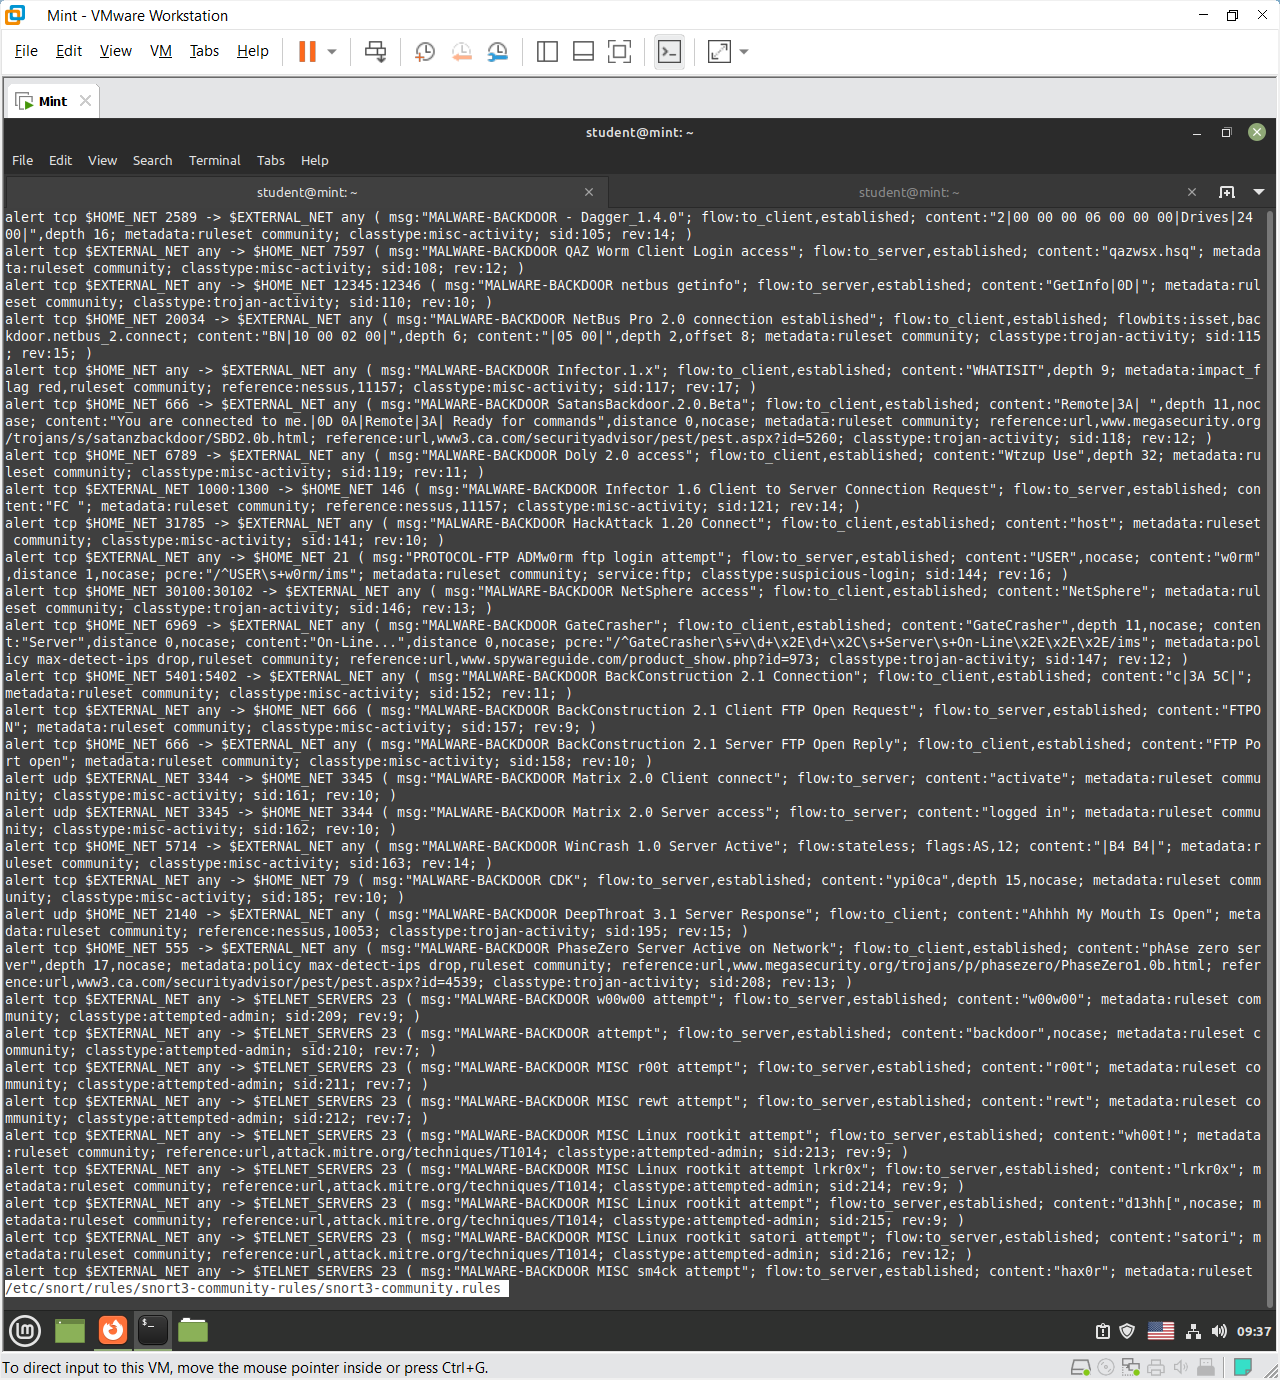
This Snort rules file contains signatures for detecting known malware backdoors. Each rule defines how Snort identifies malicious traffic based on TCP ports, data patterns, and flow direction. For example:
- The Dagger and QAZ Worm rules detect backdoor communication using specific payload strings.
- The NetBus and SatansBackdoor rules identify trojan connections by matching unique command patterns or port numbers (e.g., 12345, 666).
- Each rule specifies the protocol (
tcp), direction ($HOME_NET→$EXTERNAL_NET), and includes metadata like classification type, reference links, and rule ID (sid).
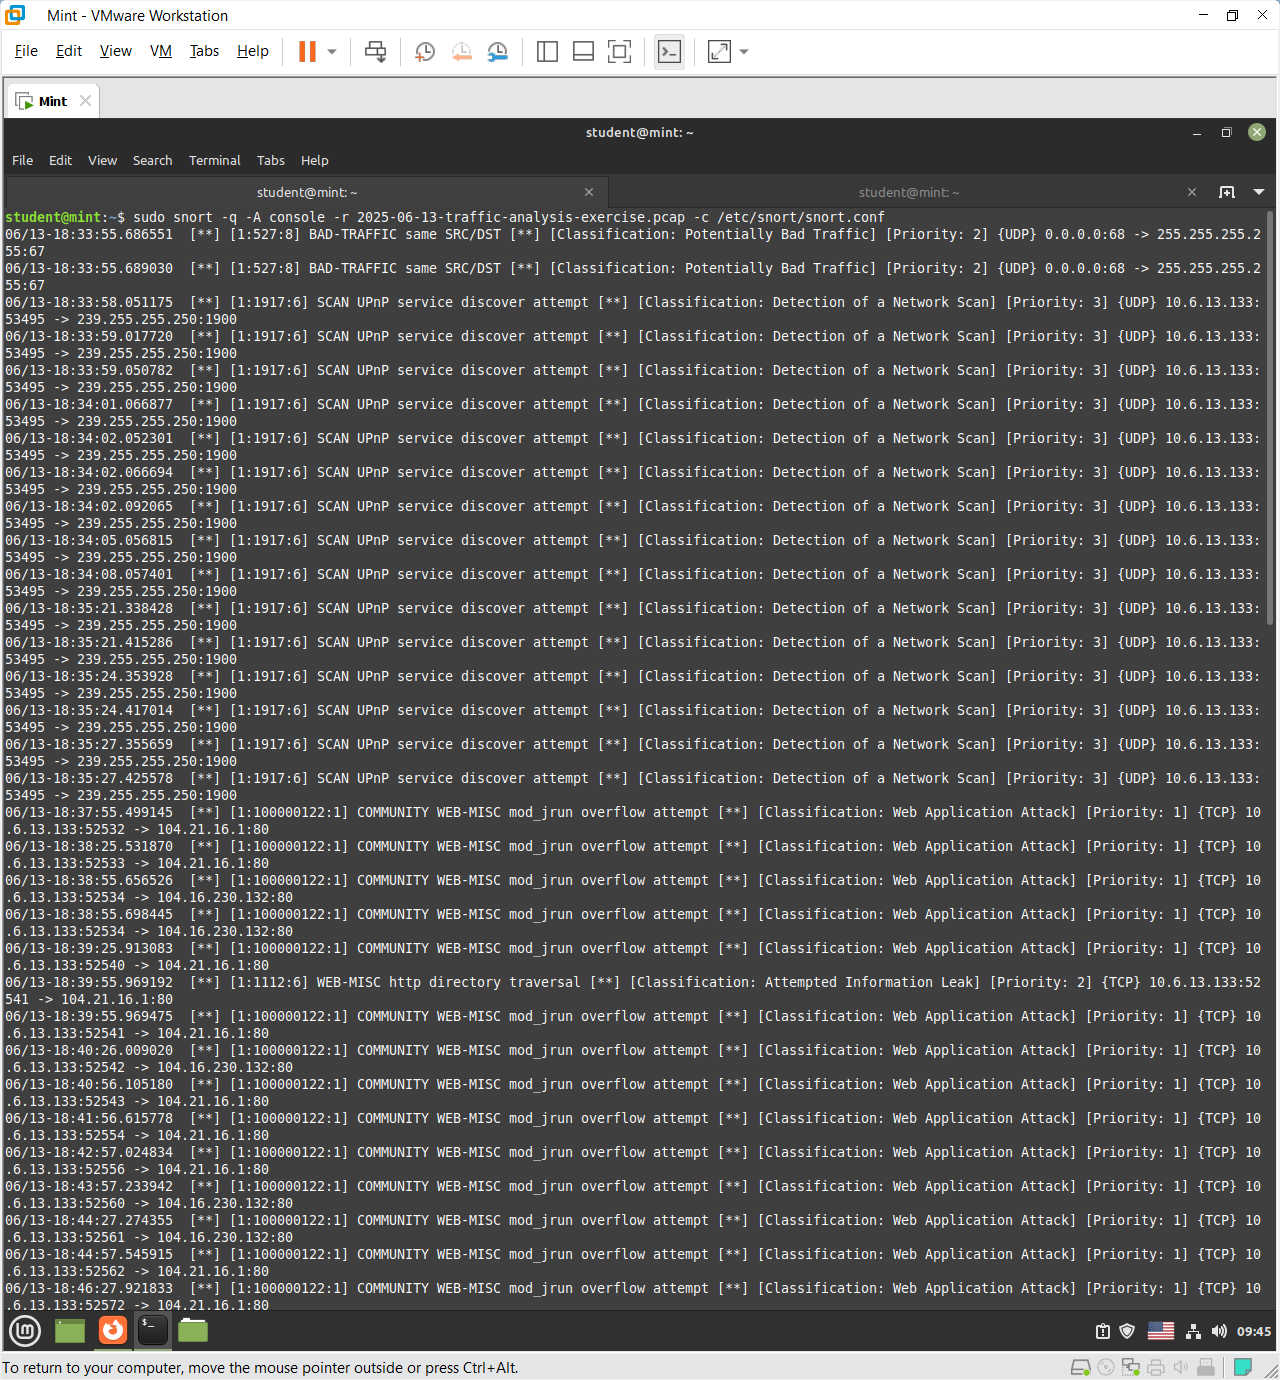
It identified the malicious attempts from the captured pcap by comparing it with the configuration file.
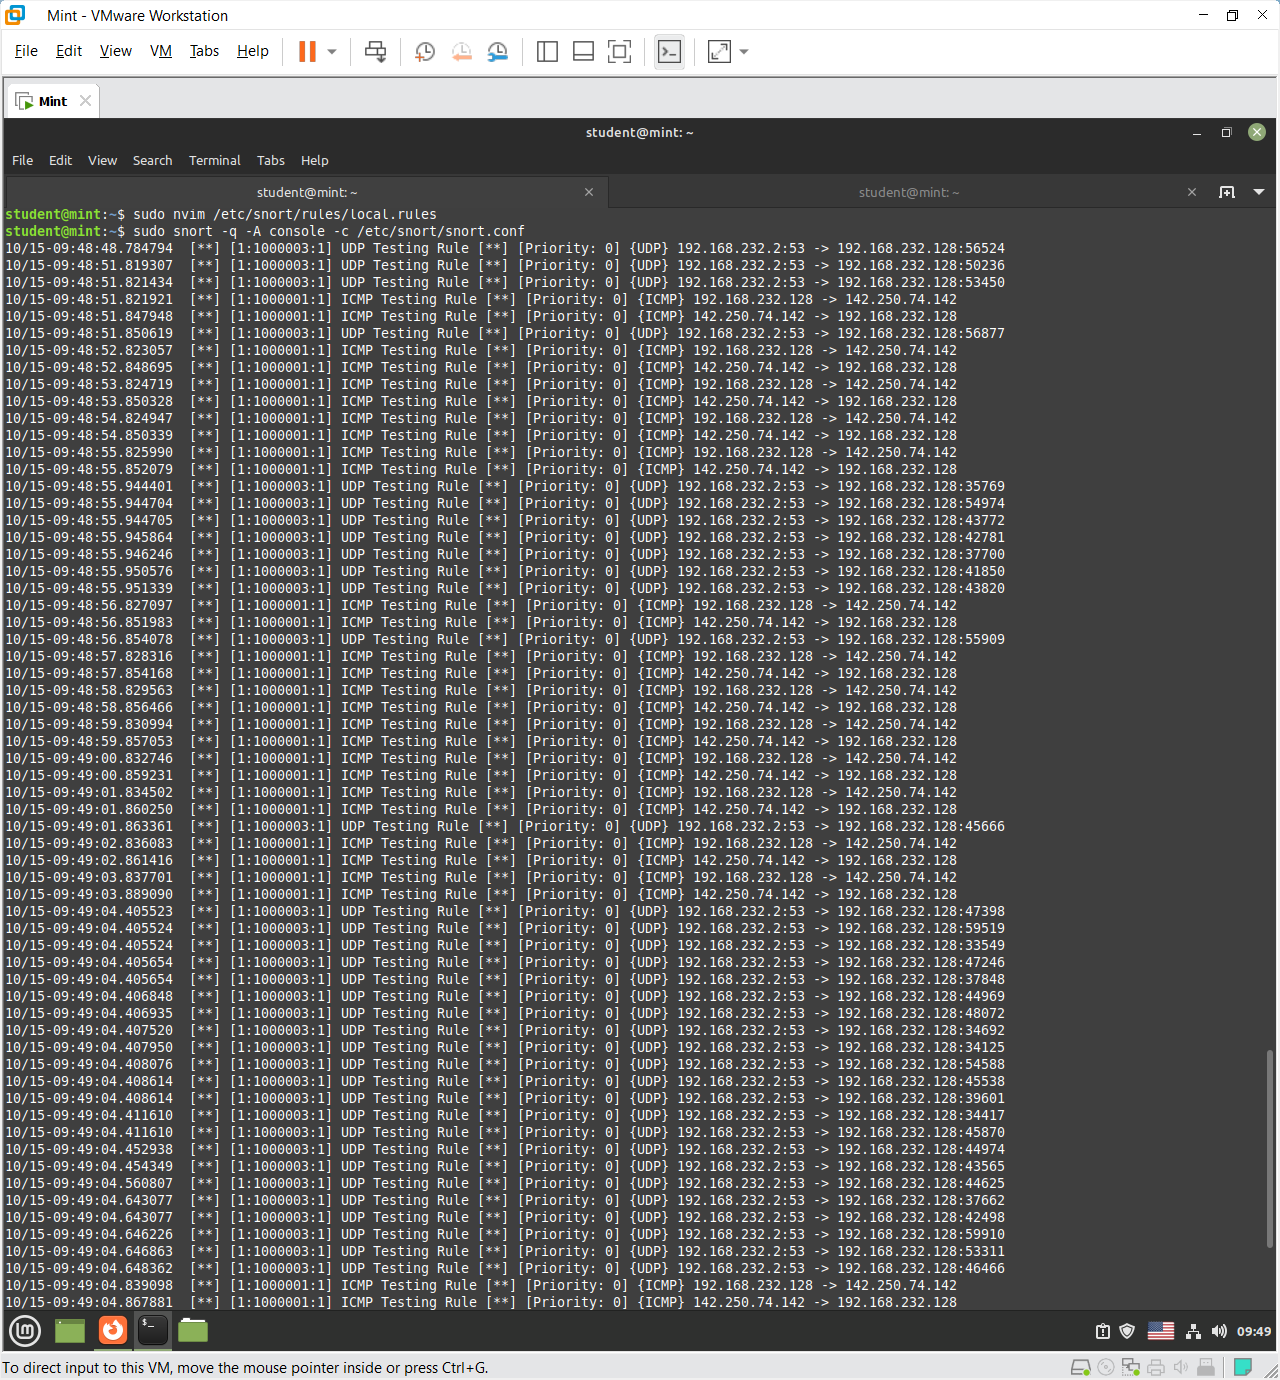
This simply alerting by sending a message whenever there is a traffic through the specified port or protocol.